cosinest
Timeline
May 2021 – Dec 2021
Project
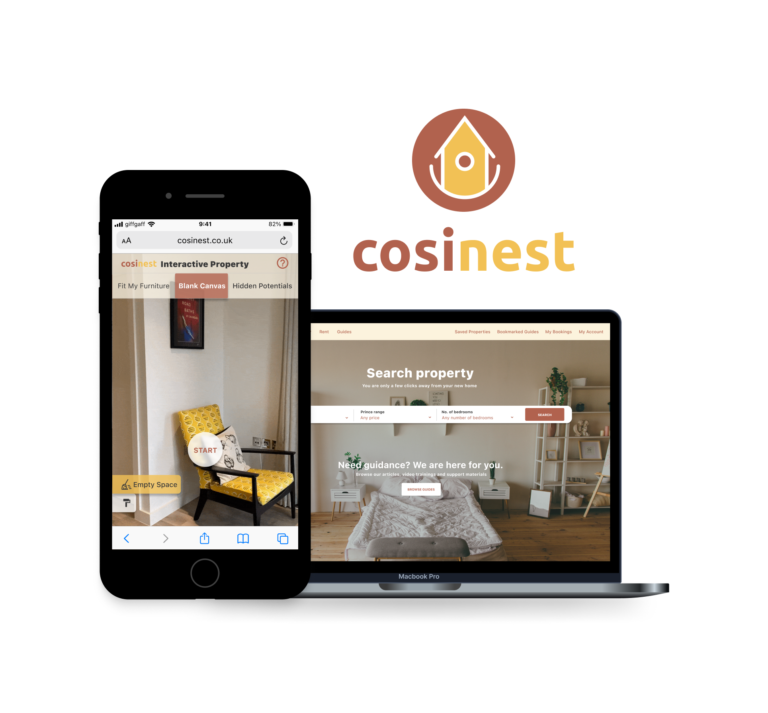
Multi-device property search experience with AR (Final Project, Kingston University)
Role
UX Researcher and Designer
Tools
Figma, Adobe Aero, Trello, Miro, MAXQDA
Context
The transaction volume in the residential real estate industry in the UK and around the world showed a dramatic decline during the Covid-19 pandemic. However, evidence shows that this is only partially a result of the lack of in-person viewings. When looking at the additional underlying issues, it is predicted that enhancing the property search with emerging technology, such as augmented reality could offer a solution.
/project aims
Help people find the most suitable property by providing transparent information and enhancing the digital search experience with augmented reality. The project will expand on the following sub-aims:
- Create transparency and build trust in the residential real estate industry
- Provide correct and detailed information
- Speed up the property search process
- Engage potential renters and buyers at the global level
- Increase transaction volume for agencies and private landlords
- Substitute in-person viewings entirely in certain circumstances
Research & Analysis
/user interviews
The potential audience was divided into three sub-groups to represent each target user type. Initially, I defined these sub-groups based on the literature review and assumptions; then, I refined them along the interviews recruitment process.
Sub-groups:
- 25-32 years old, looking for a property to rent
- 33-44 years old, looking for their first property to buy
- 45+ years old, experienced buyers looking for additional property to buy
/inductive thematic analysis
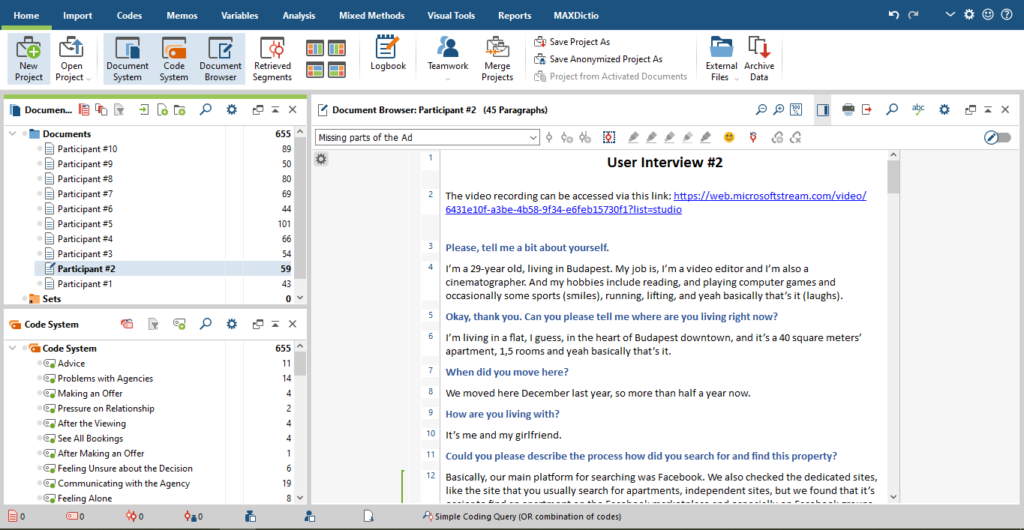
I used the inductive thematic approach to analyse the qualitative data. For the first part, I coded the ten interviews in MAXQDA. Then, I transferred the code system to a Miro board and identified the key themes and findings.
/personas
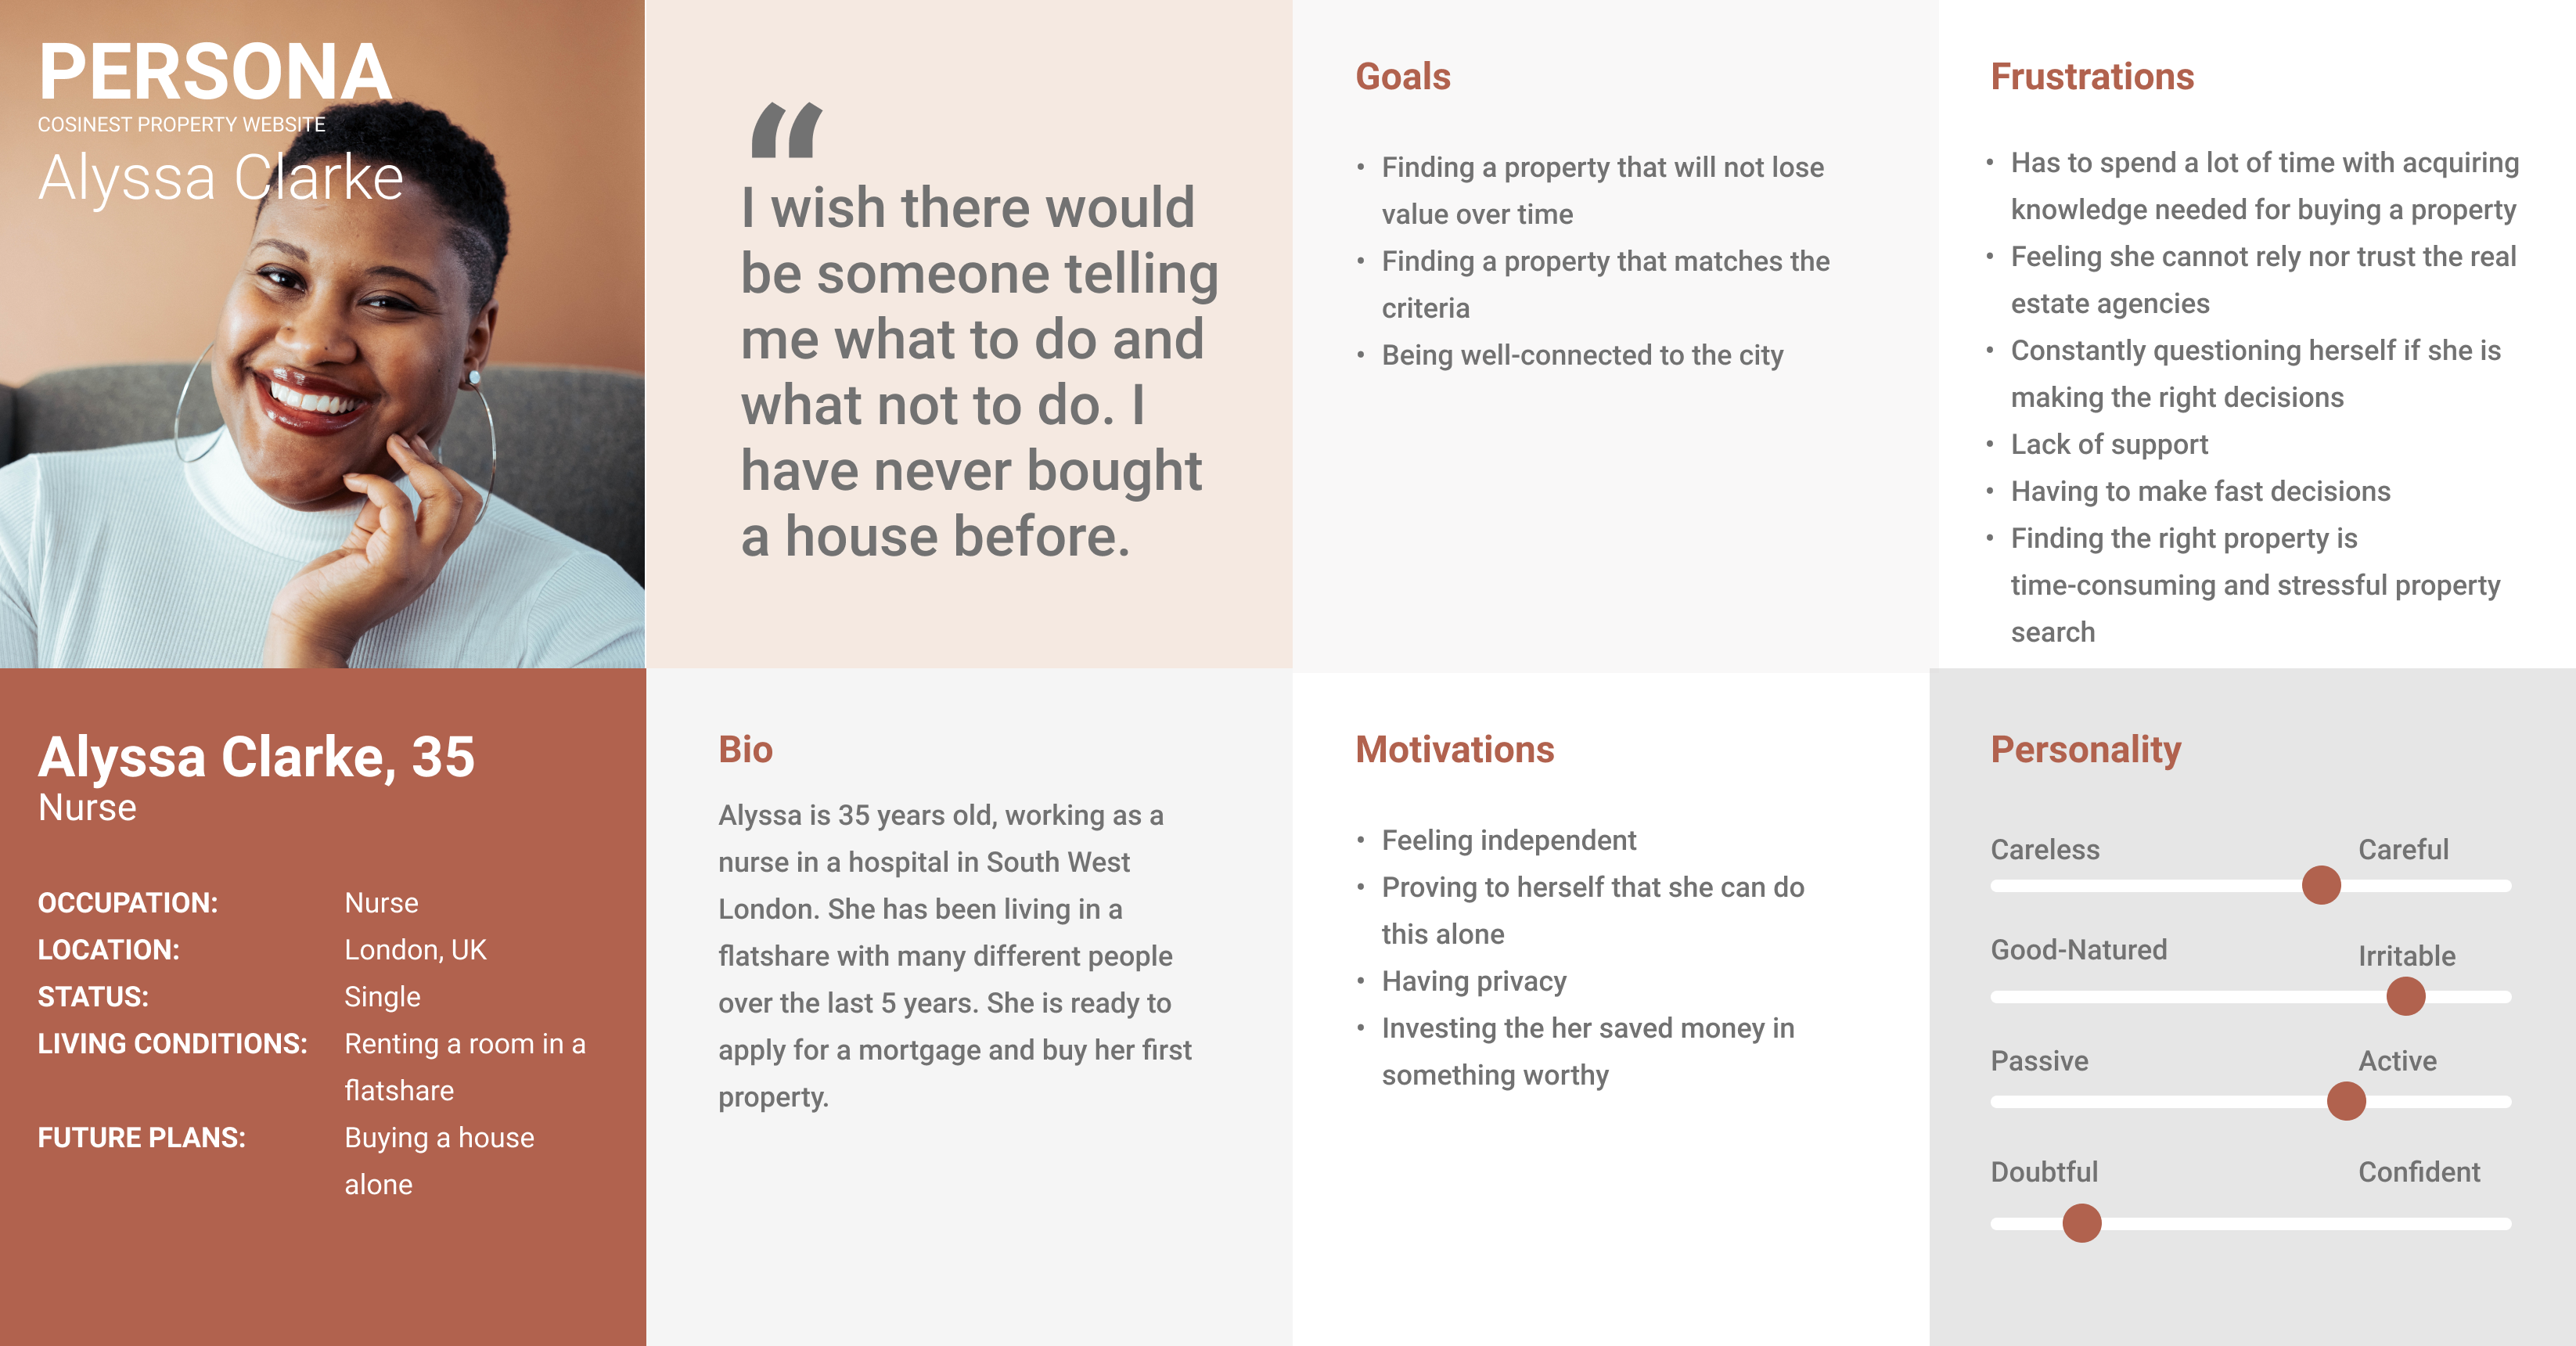
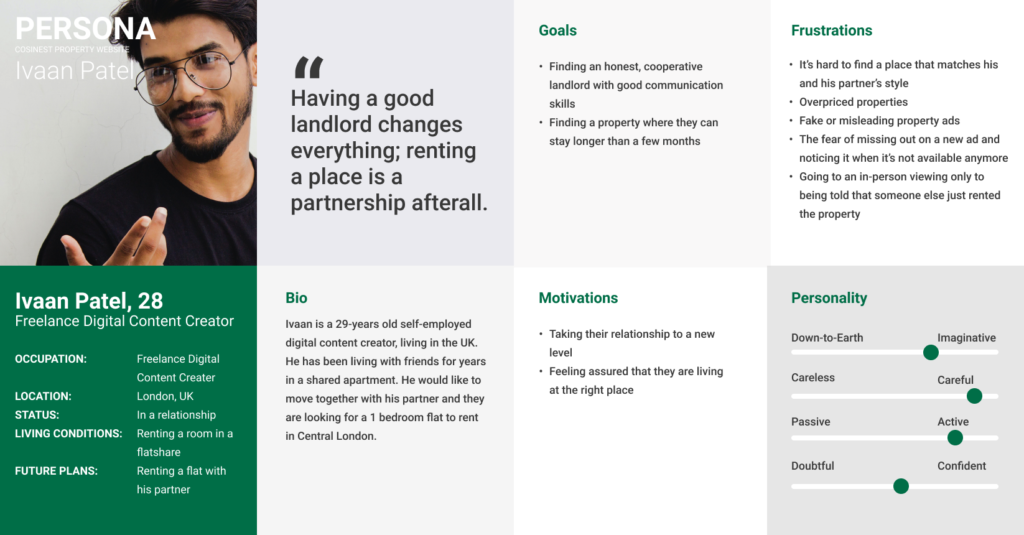
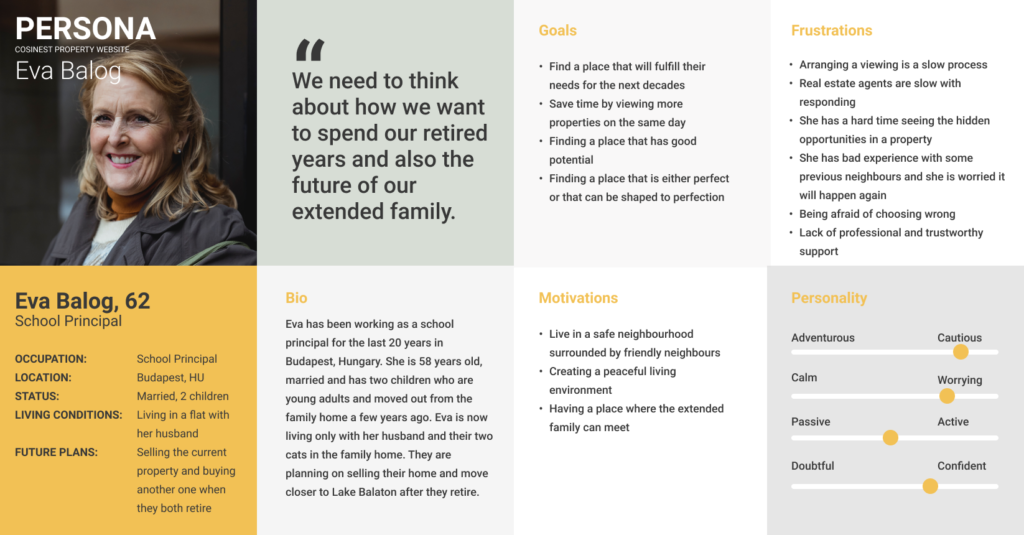
The key findings helped in refining the frustrations and motivations of the personas, and to draw a realistic image of their living conditions and goals.
As a few examples,
- interviewing a single person who is buying a property alone, highlighted several interesting pain points that did not appear before when couples were interviewed. Such as, feeling alone and seeking guidance from external sources.
- creating a goal with a deeper meaning for Eva, the persona of the user group above 45. Their goal is to find a place that will fulfil the extended family’s needs for the following decades, which defines how Eva searches for a property.
/user journeys
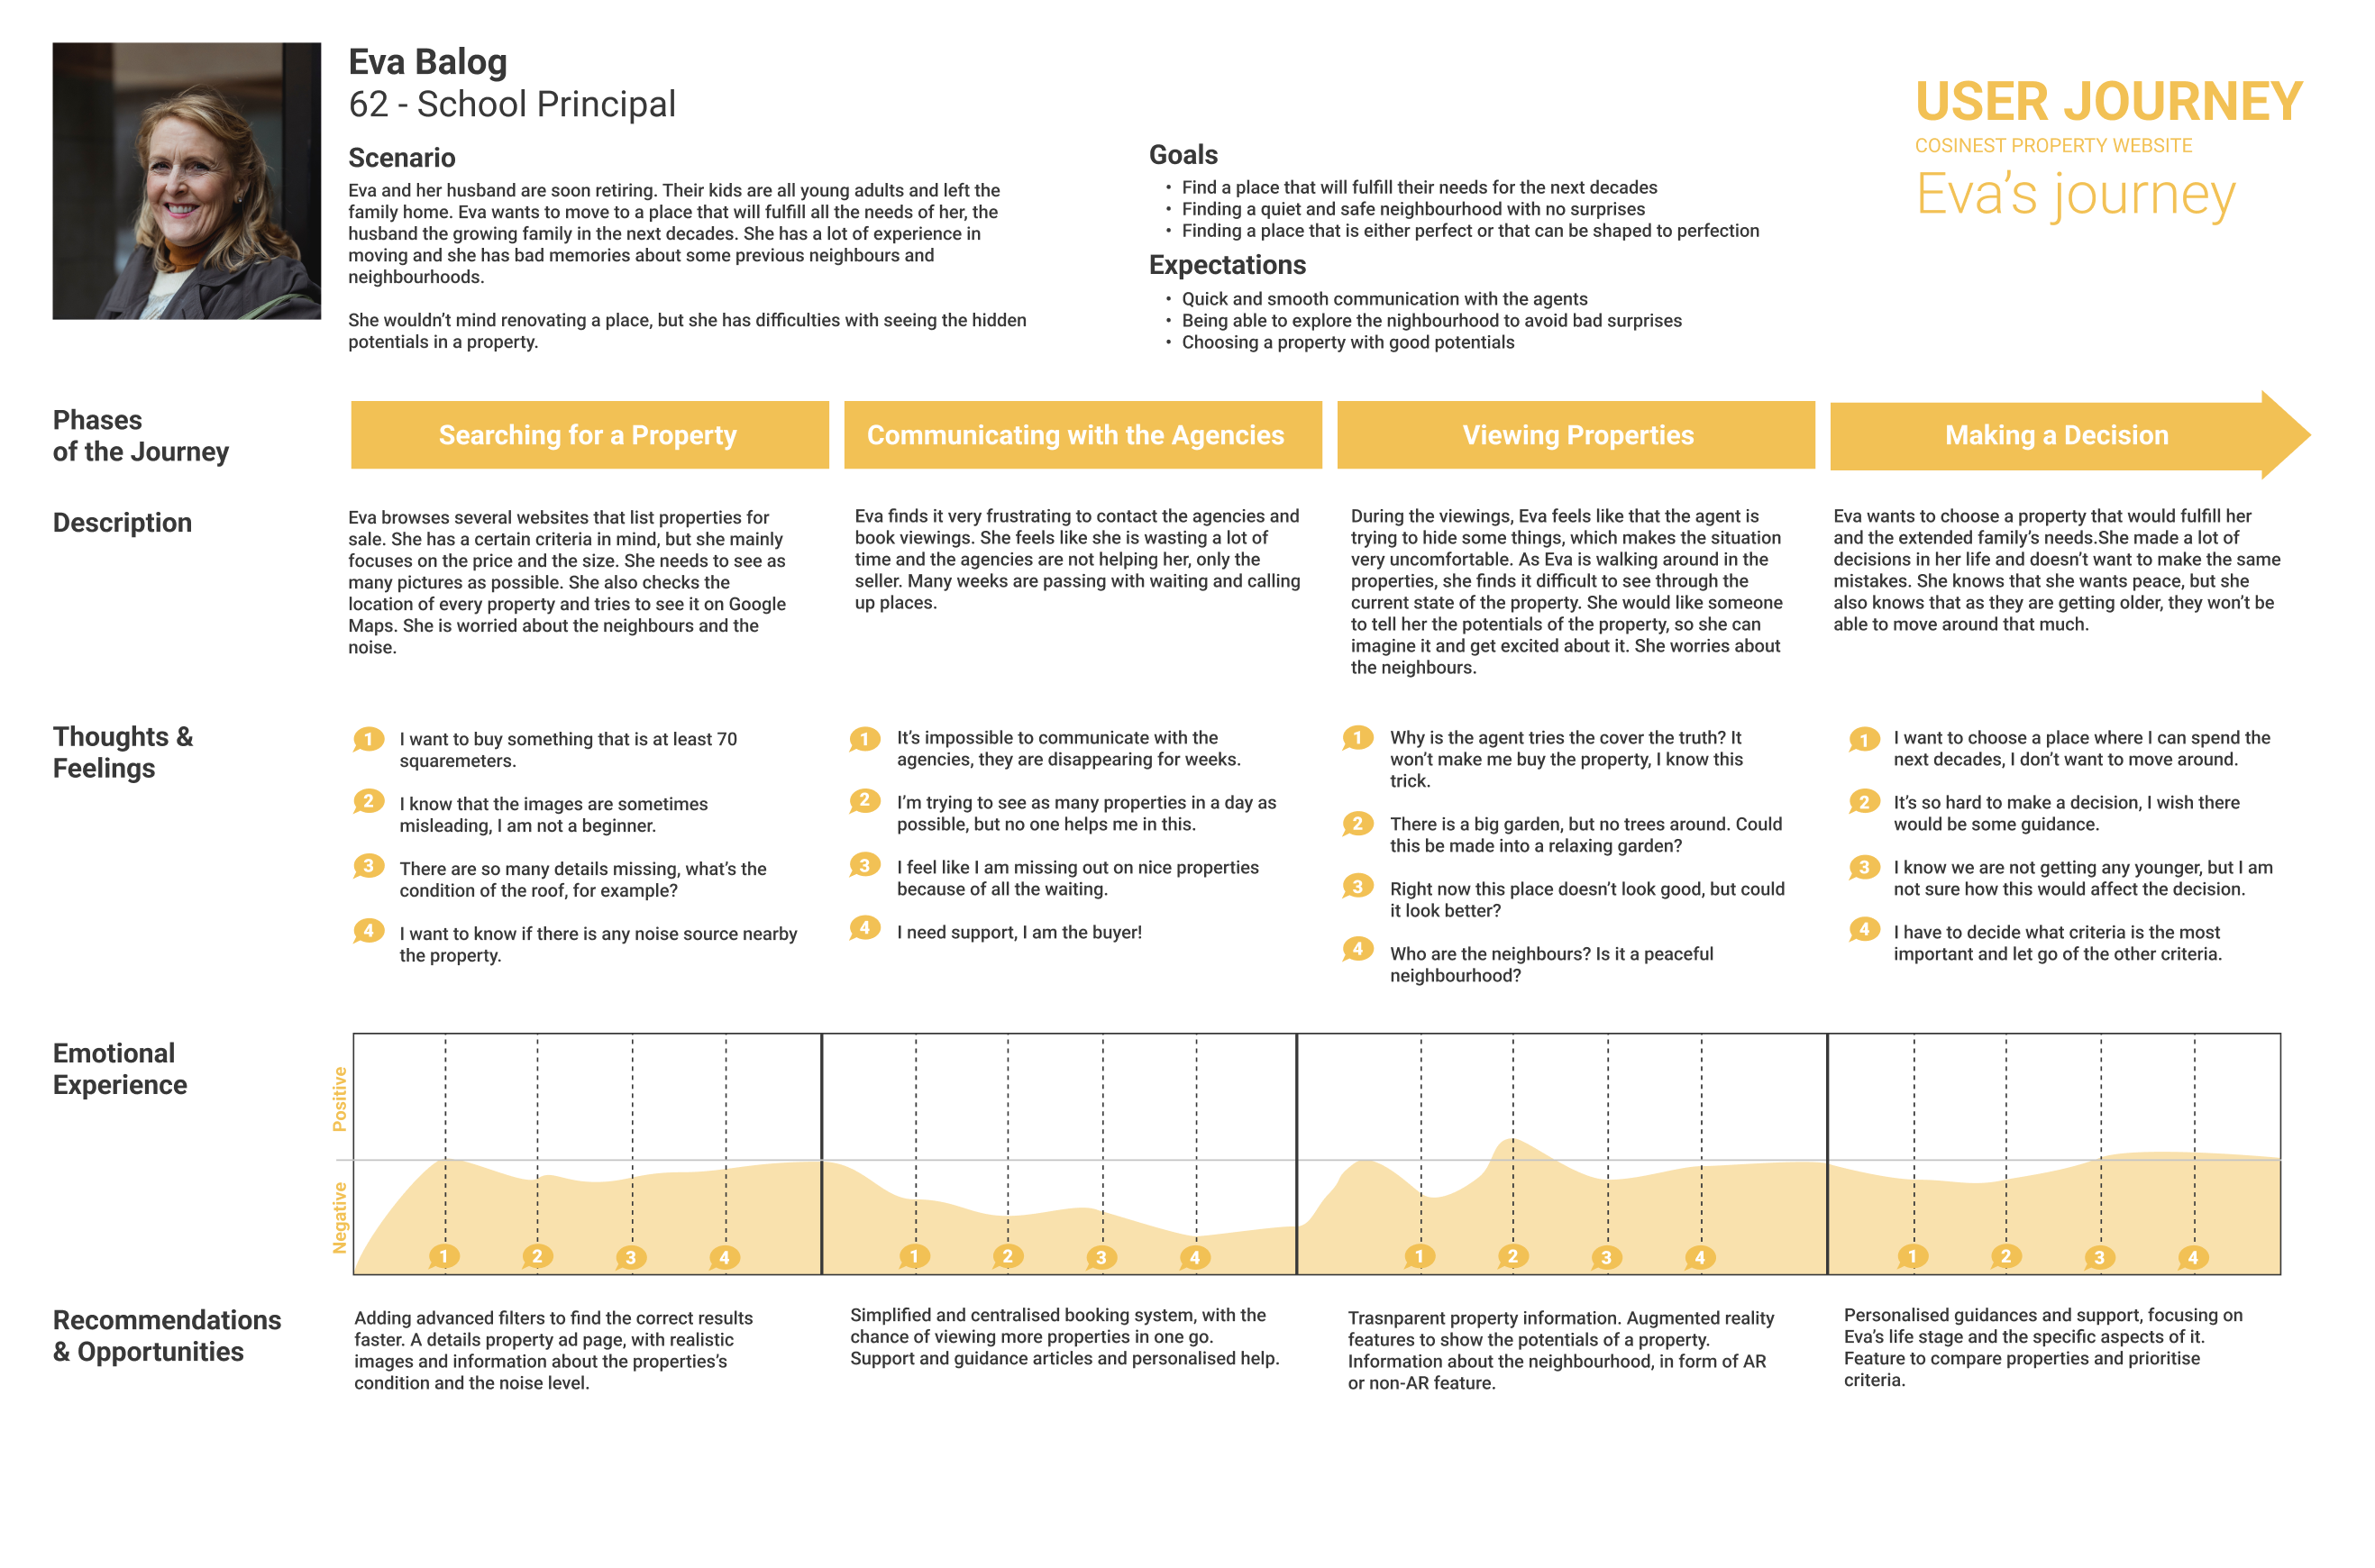
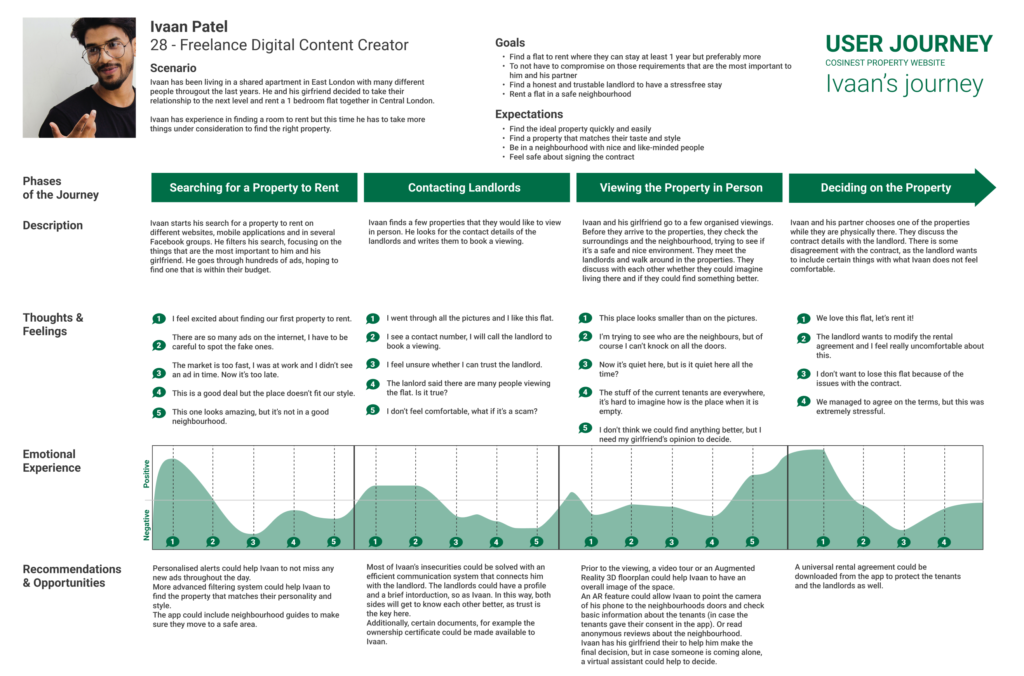
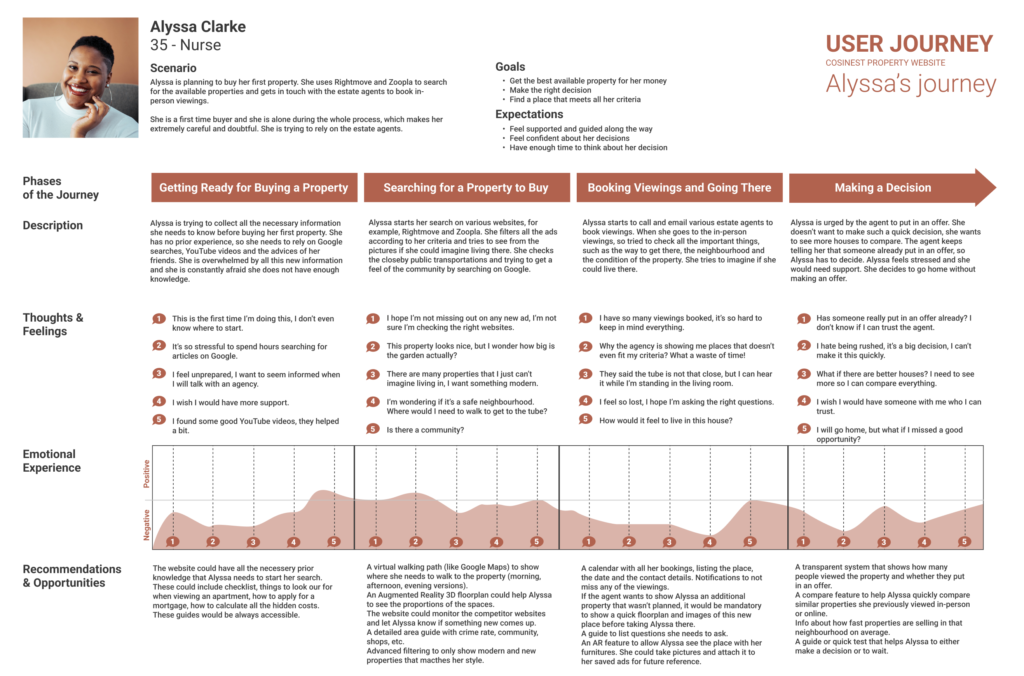
I created user journey diagrams to draw a clear picture of the users’ thoughts and feelings while searching a property, going for viewings and making the final decision. The pain points became visible on the emotional experience chart, which helped list the solutions and feature ideas for cosinest.
Ideation
/multi-device experience
When the participants discussed what online tools they use and how, the finding was that everyone prefers browsing the property ads on a bigger screen, namely a desktop, despite the age group, however, the chosen device becomes a mobile phone when they are on the go and want to get some information quickly and efficiently.
This significantly justified the need for a multi-device product.
/final features
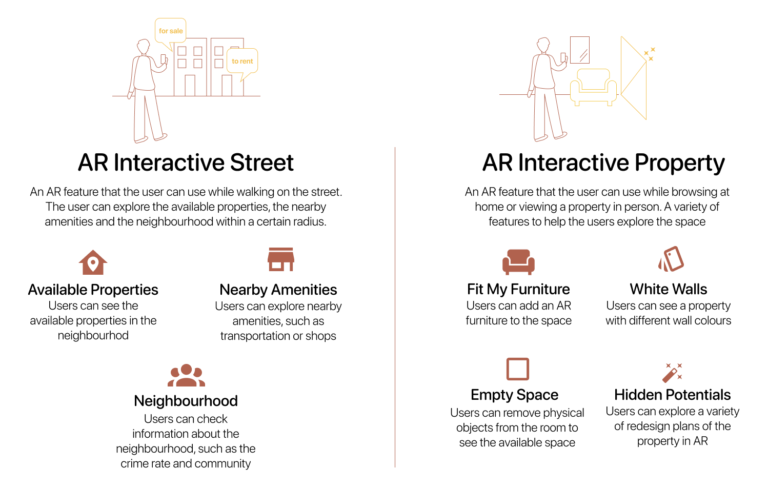
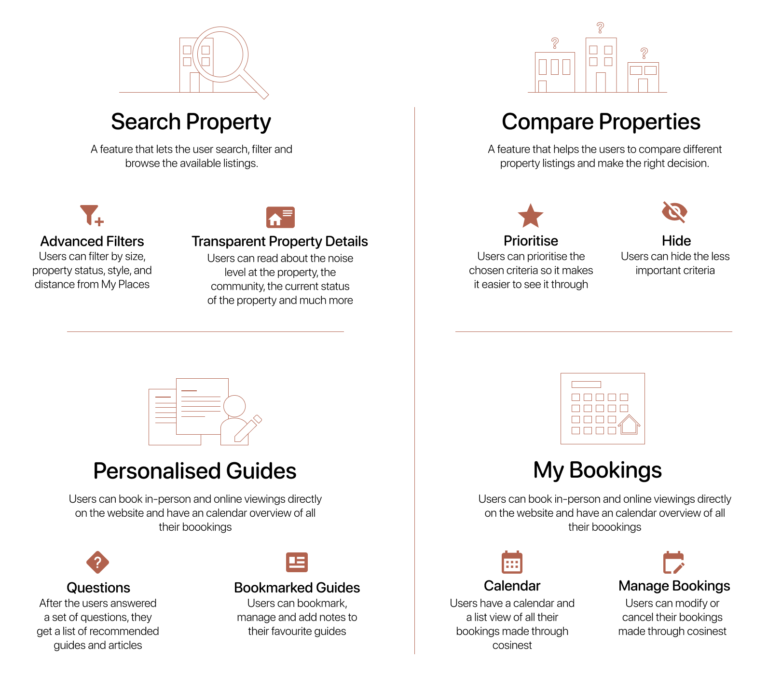
Interestingly, the key findings pointed towards creating both AR and non-AR features. This result is a significant refinement of the design as the initial assumption and plan solved the user problems using only AR.
I want to highlight that every feature was brainstormed and implemented solely based on the research data. This means that they are all expected to solve the pain points of at least one persona, but preferably all.
/branding

Prototype
/user flow diagrams
I created several user flow diagrams to make sure the users do not experience cognitive overload, and they can complete a task intuitively and time-efficiently. Given the multi-device experience, I ensured that each diagram clearly show how the users move across devices.
/1st design iteration
In total, I did three rounds of design iterations for both desktop and mobile experience. Each iteration had a design, testing and evaluation phase.
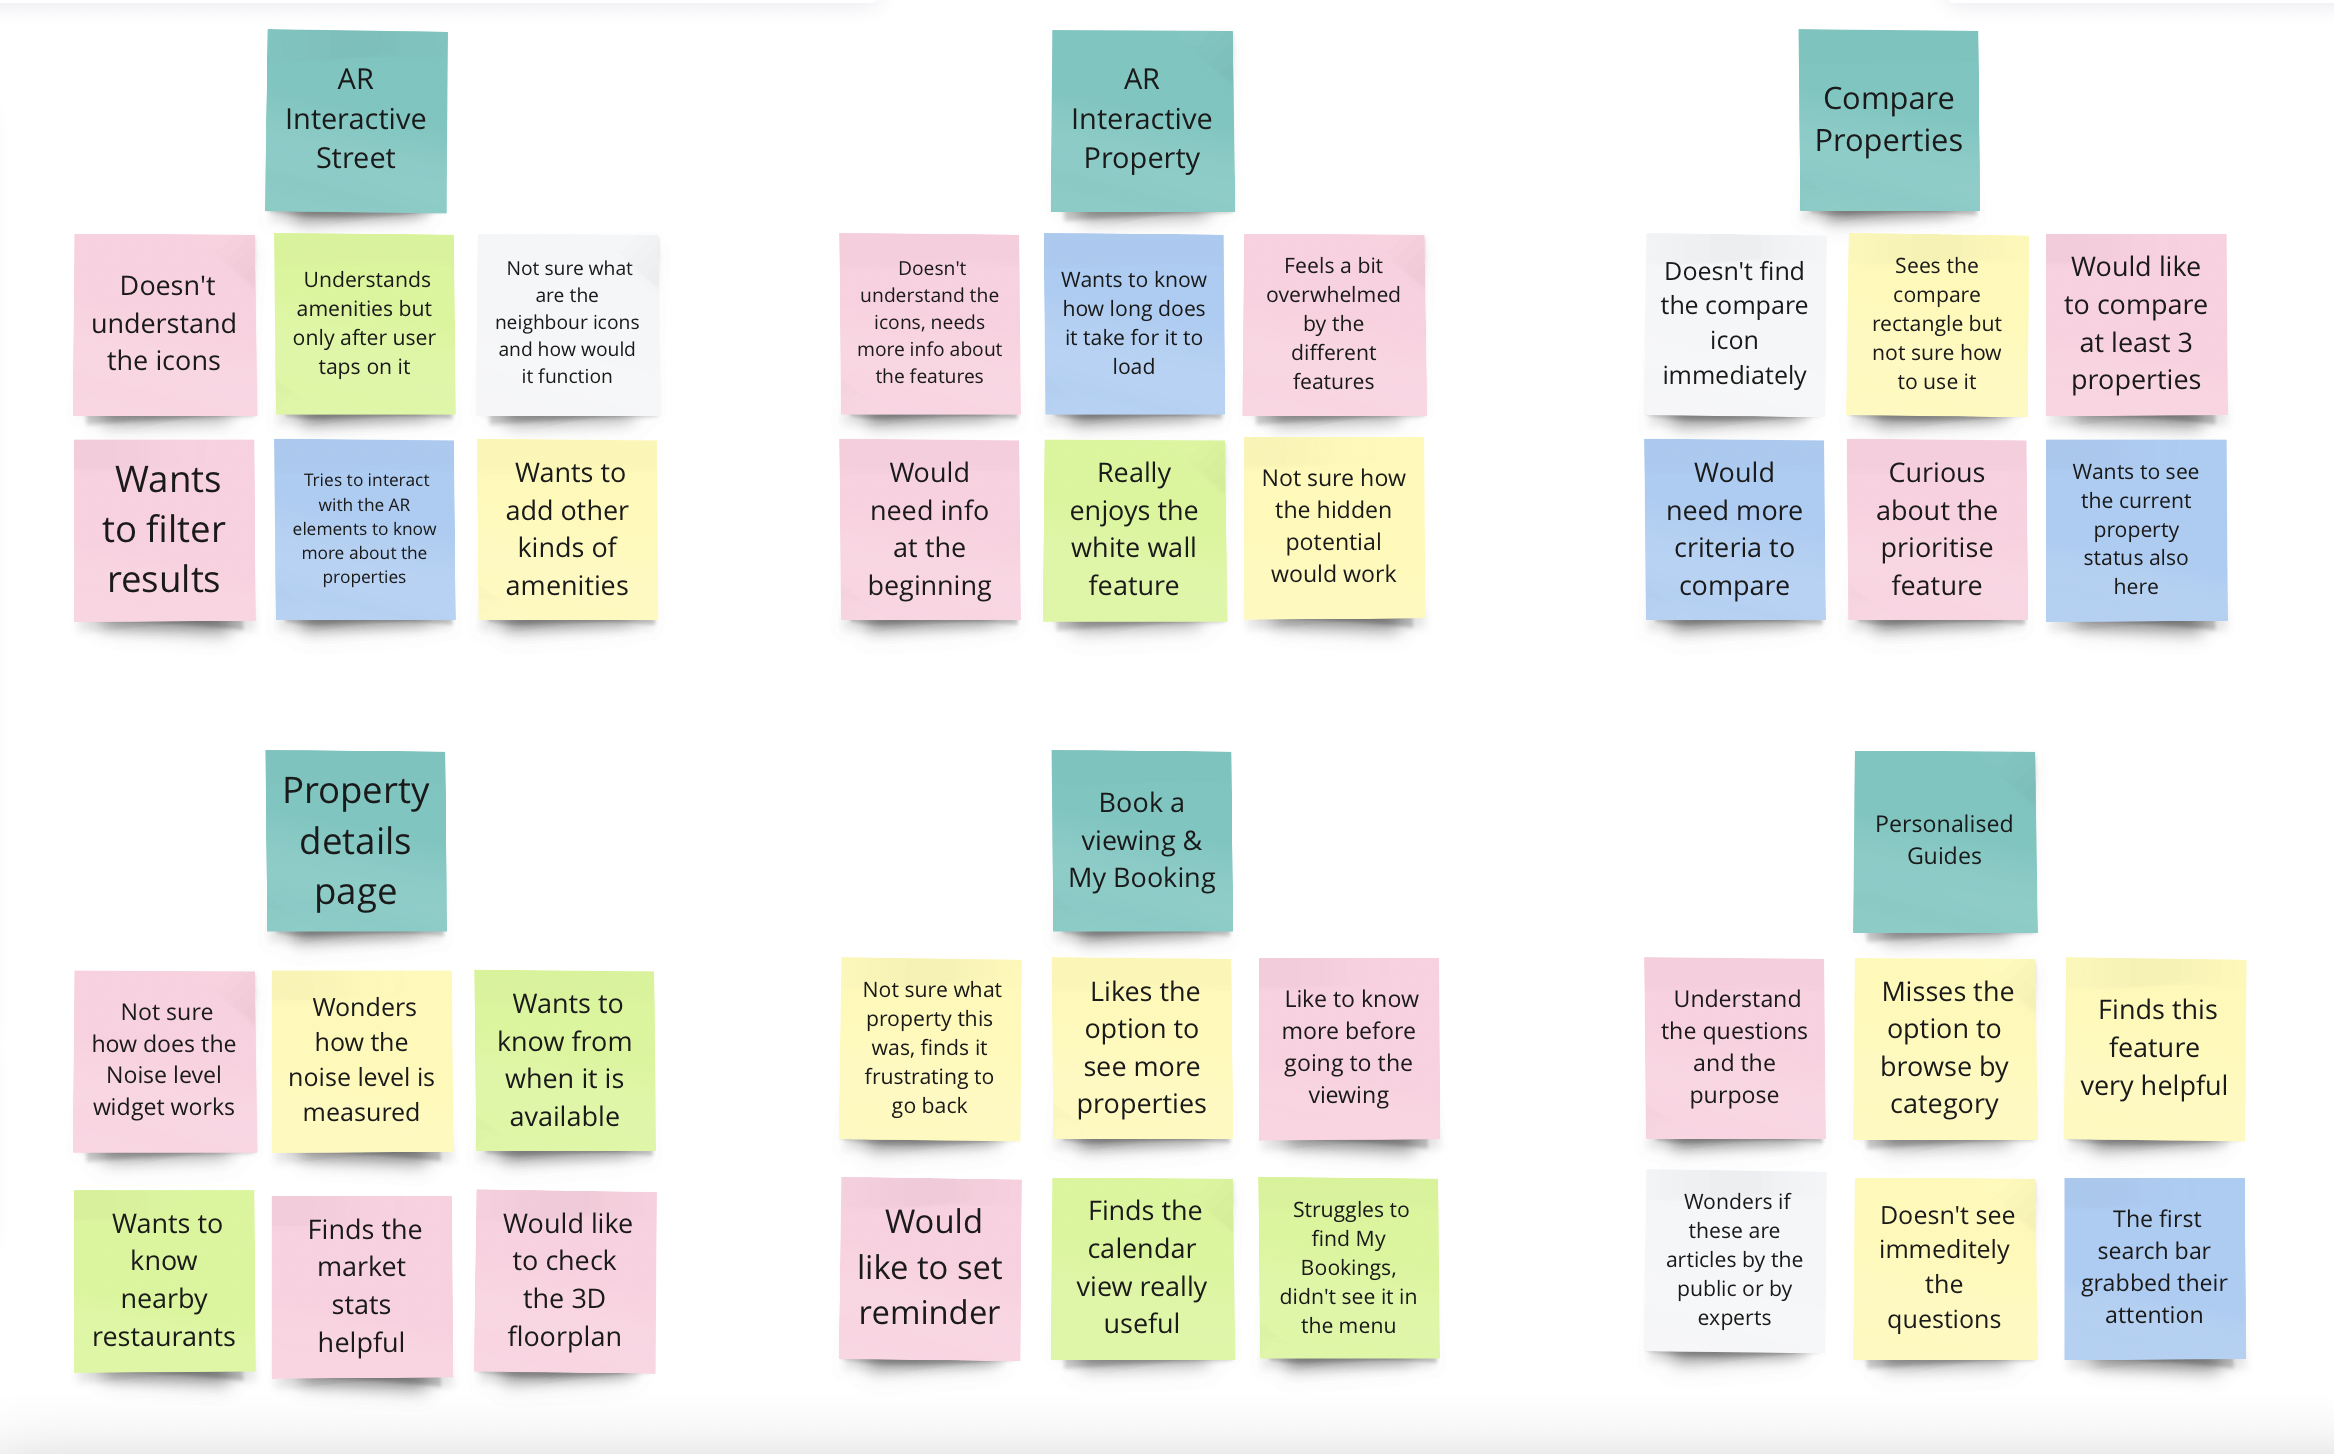
I started with a simple design to test the flow and the core idea with users from the three primary user groups. I recorded the testing sessions soI could dedicate my full attention to the participants. Then, I extracted the findings and organised them on a Miro board.
/2nd design iteration
The second version of the design provided more interactivity, and I also added the AR elements.
Whenever possible, I conducted the testing sessions at that exact location where I previously recorded the AR elements. Considering the available resources and time, this proved the best way to mimic the AR functionality.
Below is the workflow I followed for implementing each AR feature at this stage. You can see how I went from the designs in Figma through Adobe Areo to the users holding the working prototype.
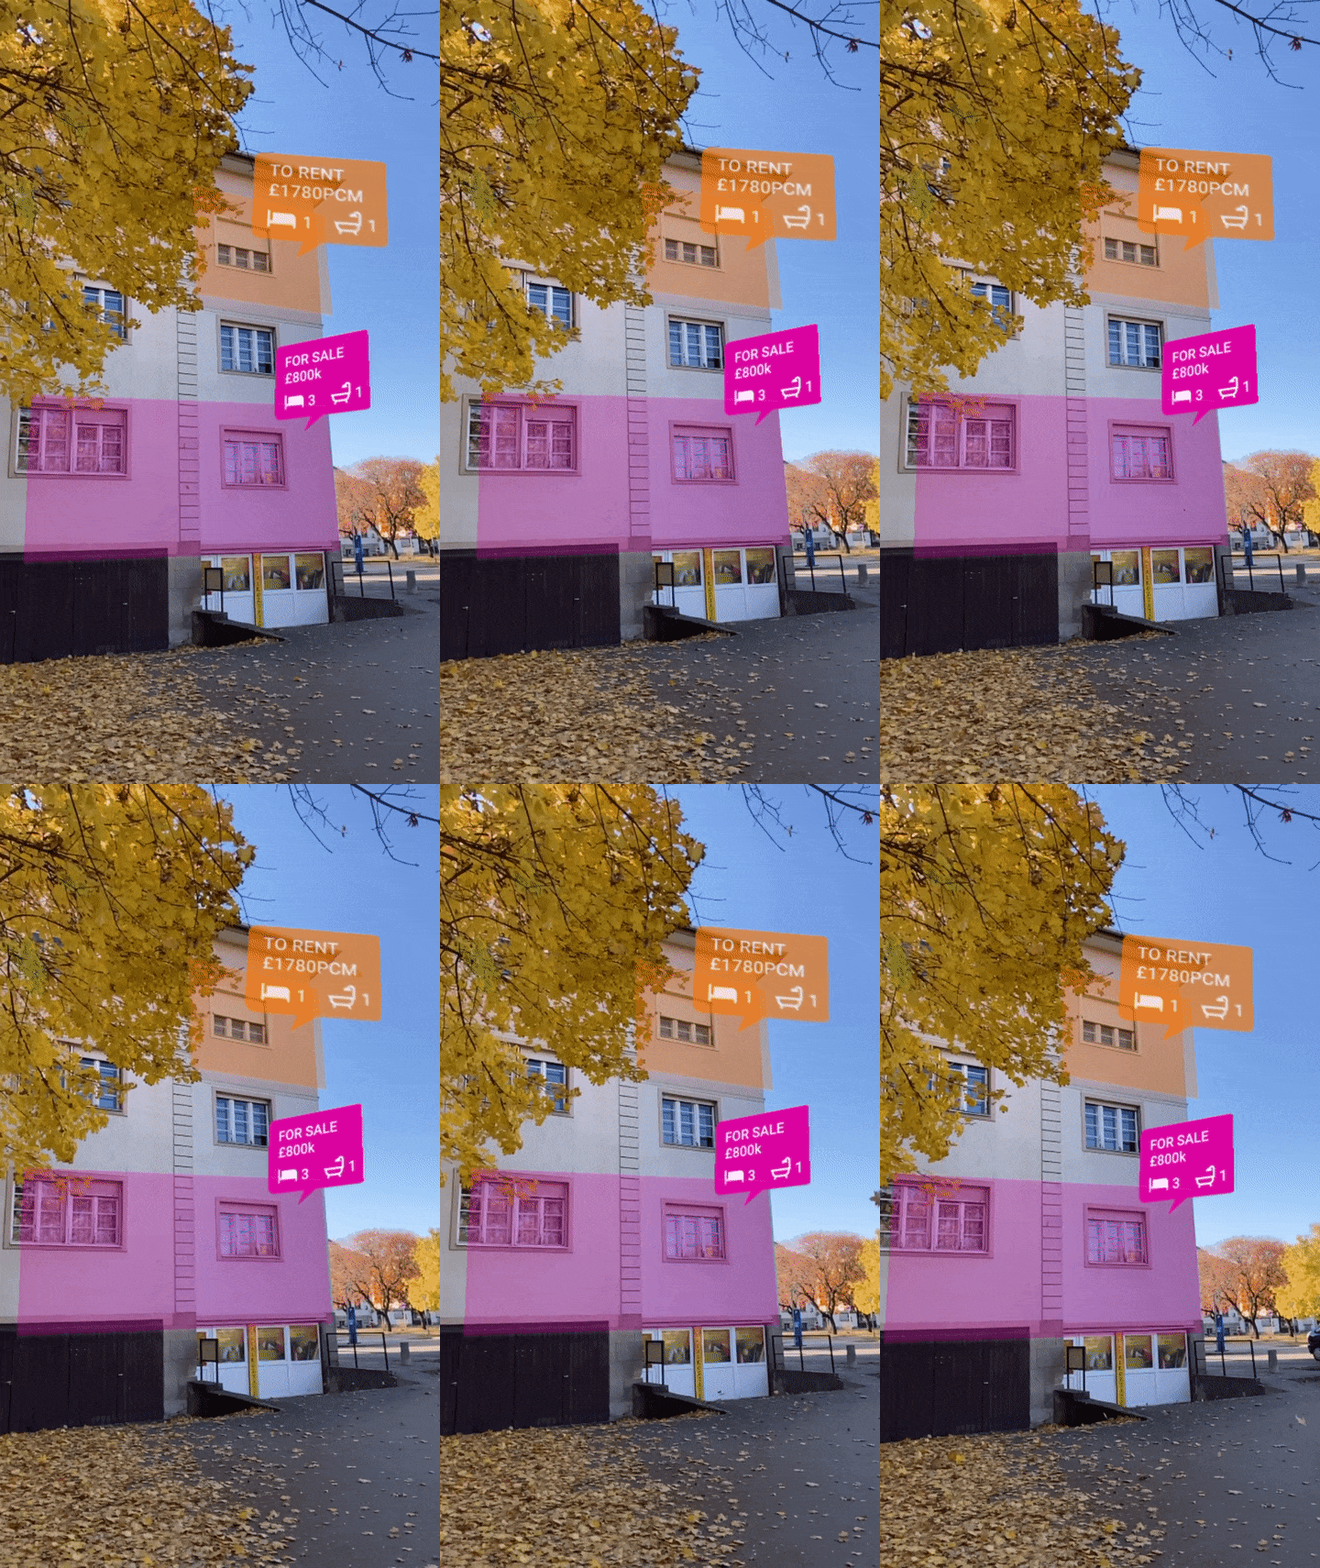

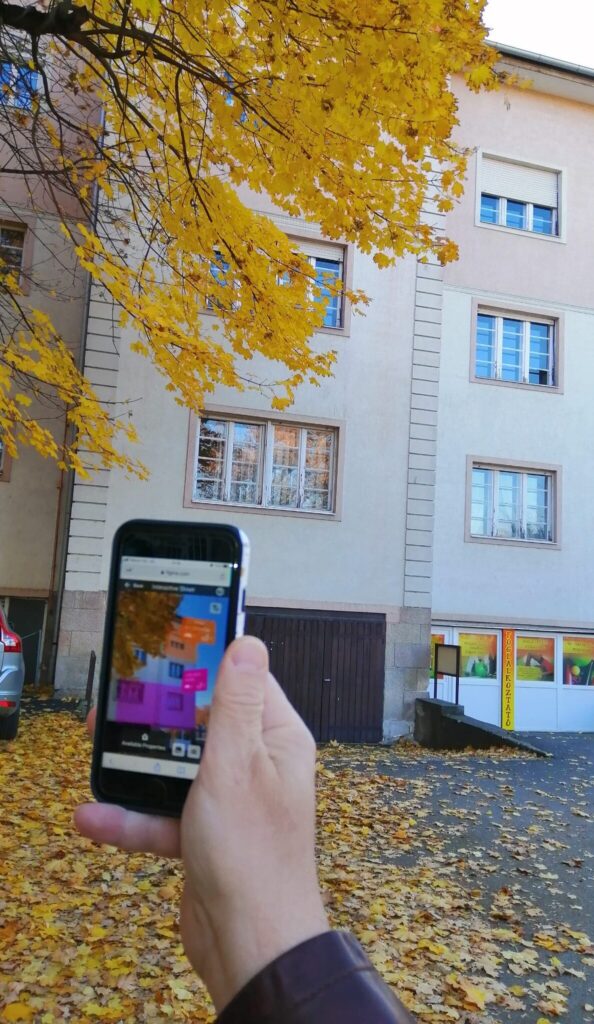
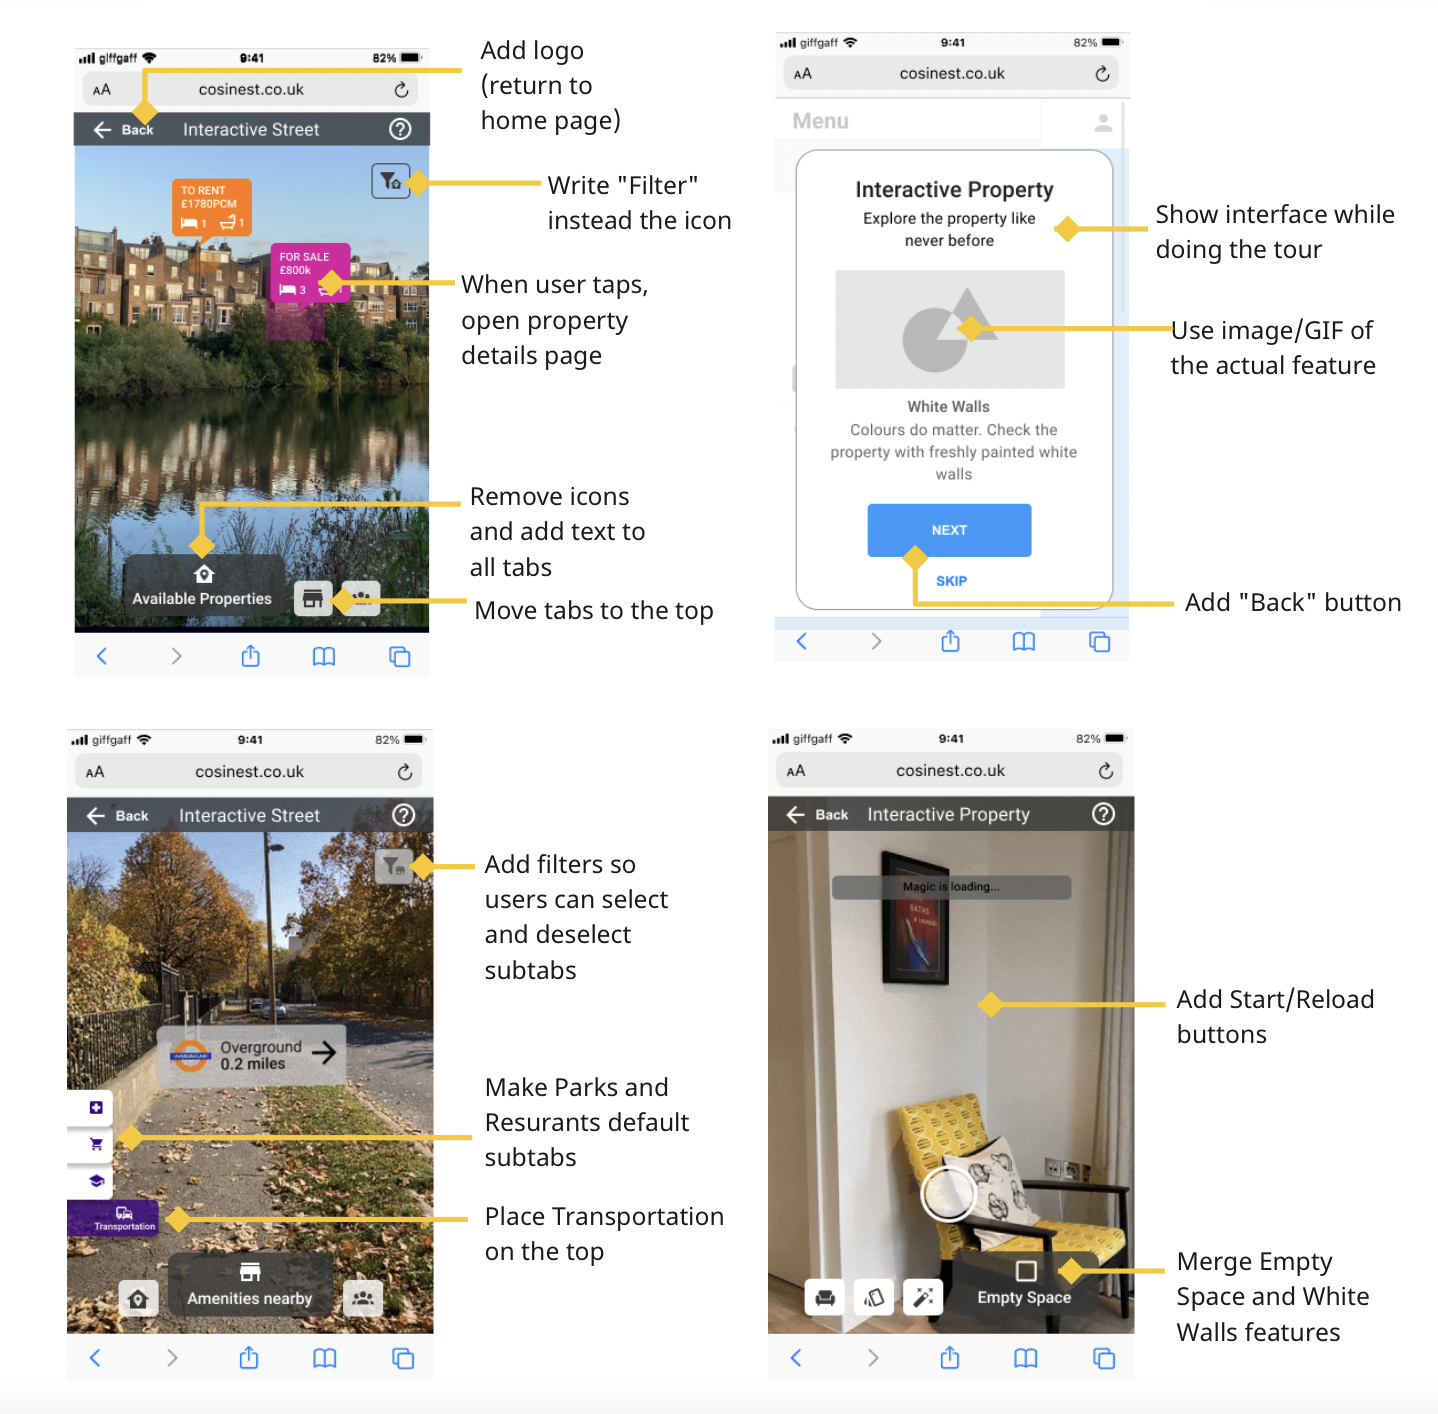
As expected, this phase highlighted more usability issues. To give a quick view of the types of issues I encountered, I listed the most significant ones below.
Mobile experience:
- Tabs in both AR features are not intuitive
There is a long learning curve for the different tabs in the Interactive Property and Street features (e.g. Available properties, Fit My Furniture, etc.) - Onboarding steps are not helpful
Users find it difficult to understand and remember the steps of the onboarding tour without seeing the feature in action - Filtering and information are limited
Users would like more advanced filters in the Interactive Street feature and more information when tap the AR objects
Desktop experience:
- Comparison table is overwhelming
Even though the users enjoy the feature, there is too much data and it is difficult to process it - Structure of the property details page
The three columns makes it hard to read the property information - Contrasts
The contrast ratio between the navigation menu and the page is too low, resulting in users not finding the menu items
/3rd design iteration
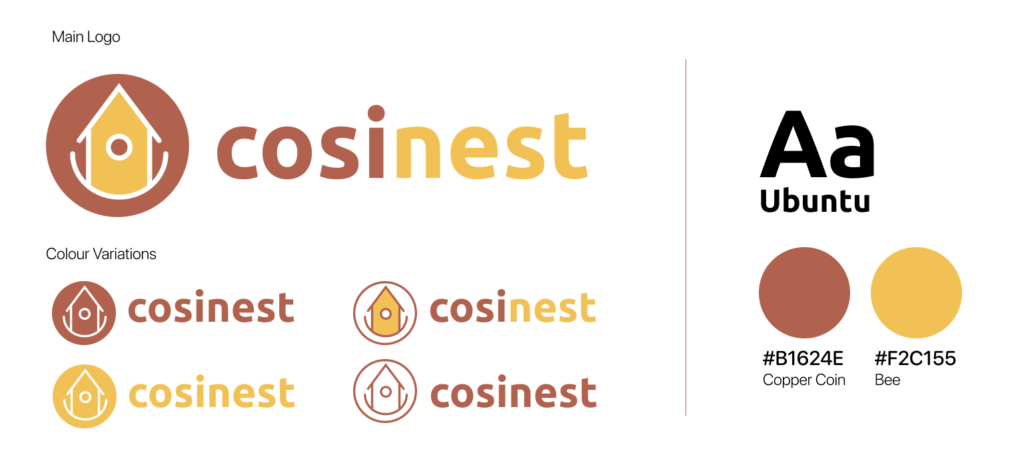
In the final iteration, the branding style guide was essential in adding the logo, primary colour and secondary colour of cosinest to the prototype. Then, the placeholder texts and images were replaced because I wanted to create a more real-life experience. The findings of the previous iterations were also built into this new design.
Also, the testing now involved using additional physical design elements, such as the paper stickers for accessing AR features during an in-person property viewing.
You can access the complete and final version of interactive prototypes below. They cover a defined set of flows.
Desktop
- Flow 1: Searching properties and filtering results
- Flow 2: Comparing properties
- Flow 3: Property details page
- Flow 4: Accessing AR Interactive Property feature from the desktop
- Flow 5: Booking a viewing and My Bookings
- Flow 6: Personalised guides
Mobile
- Flow 7 & 8: AR Interactive Street
- Flow 9 & 10: AR Interactive Property
Final thoughts
/challenges and development
One of the biggest challenges of this project was the usage of Web AR; even though users did enjoy these AR features, there is a learning curve and this raises some questions.
I made sure to address every high impact usability issue flagged during the testing. I designed and kept refining the onboarding tour so also novices could use and enjoy the AR features after a short introduction.
When we look at the desktop experience, the Compare Properties feature has the potential to become a core feature as the learning curve is negligible compared to the positive effect of the feature on the users. Also, having some unusual and transparent property data, such as the noise level during the day and the evening, positively surprised the users and they were highly appreciating it.
/going forward
As a next step, additional usability sessions could be organised but this time with a functioning beta version of the product. To minimise the costs, initially, there could be a small number of cosinest verified properties, where the people arriving for in-person viewings could try the Interactive Property feature. At the end of the viewings, the users could fill in a short questionnaire to measure user satisfaction.
At a later stage, statistical data analysis could potentially prove a correlation between the transaction volume and the use of cosinest.
